
There is a growing number of websites that display various geolocation information using an interactive map object, for example, an amChart. A well-designed map display could provide visitors a quick glance of important information. For example, a statistical company could use the map to illustrate the service utilization rates globally, or a disease control department could display a real-time epidemic outbreak clearly on a map, and so on.
In this article, we will demonstrate how to map the countries using the IP2Location geolocation database based on IP addresses.
- In this example, we will pre-define a set of IP-countries information for the map highlighting. Please note that in reality, this information should be retrieved from a source, such as database, real-time web data, user input and so on.
var myJSON = [ { "IP_Number": "16909059", "IP_Version": 4, "IP_Address": "1.2.3.3", "Country_Code": "AU", "Country_Name": "Australia", "Region_Name": "Queensland", "City_Name": "Brisbane" }, { "IP_Number": "33907478", "IP_Version": 4, "IP_Address": "2.5.99.22", "Country_Code": "FR", "Country_Name": "France", "Region_Name": "Hauts-de-France", "City_Name": "Lille" }, { "IP_Number": "553784885", "IP_Version": 4, "IP_Address": "33.2.22.53", "Country_Code": "US", "Country_Name": "United States of America", "Region_Name": "Ohio", "City_Name": "Columbus" }, { "IP_Number": "721947651", "IP_Version": 4, "IP_Address": "43.8.12.3", "Country_Code": "JP", "Country_Name": "Japan", "Region_Name": "Tokyo", "City_Name": "Tokyo" }, { "IP_Number": "891958082", "IP_Version": 4, "IP_Address": "53.42.51.66", "Country_Code": "DE", "Country_Name": "Germany", "Region_Name": "Baden-Wurttemberg", "City_Name": "Stuttgart" }]; - Next, create a new project and insert the below codes:
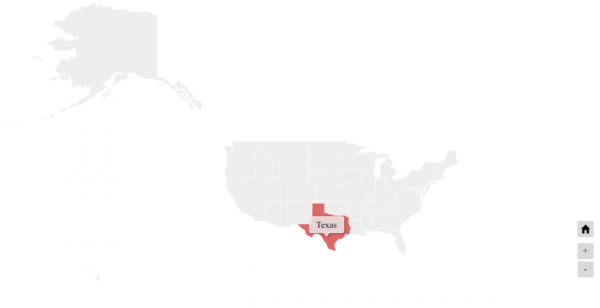
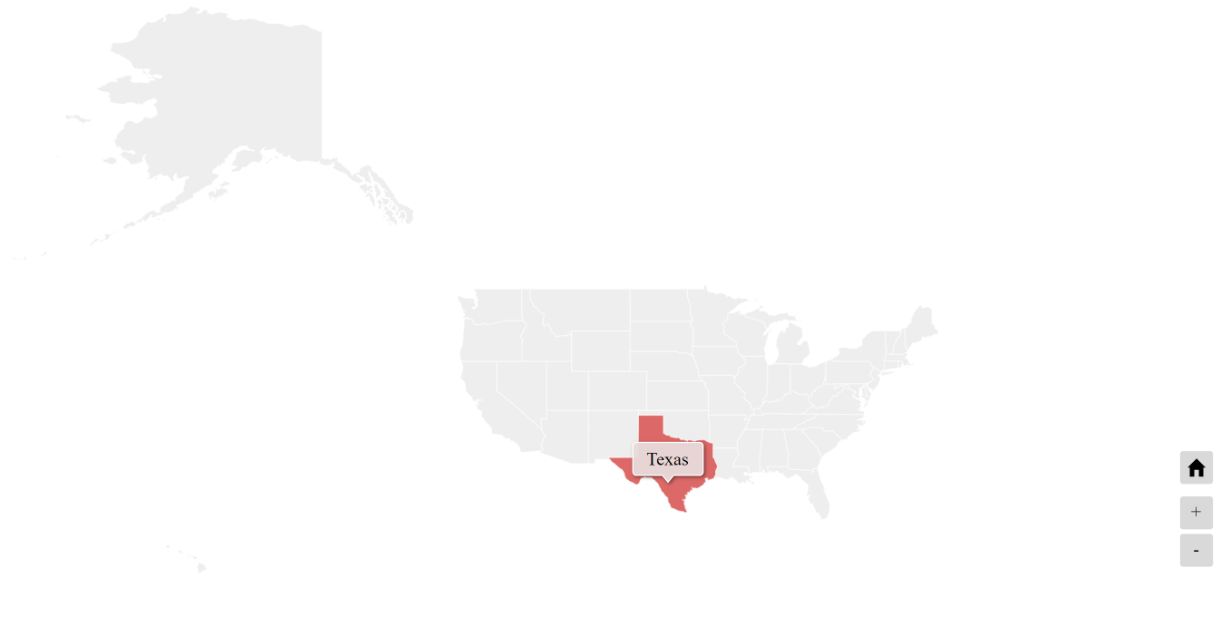
i) Add a function to display the highlight of the countries that is returned by the IP2Location IP lookup into the JavaScript code(countryHighlightJS.js)am4core.ready(function () { var myJSON = […]; // Themes begin am4core.useTheme(am4themes_animated); // Themes end var continents = { "AF": 0, "AN": 1, "AS": 2, "EU": 3, "NA": 4, "OC": 5, "SA": 6 } // Create map instance var chart = am4core.create("chartdiv", am4maps.MapChart); chart.projection = new am4maps.projections.Miller(); // Create map polygon series for world map var worldSeries = chart.series.push(new am4maps.MapPolygonSeries()); worldSeries.useGeodata = true; worldSeries.geodata = am4geodata_worldLow; worldSeries.exclude = ["AQ"]; var worldPolygon = worldSeries.mapPolygons.template; worldPolygon.tooltipText = "{name}"; worldPolygon.nonScalingStroke = true; worldPolygon.strokeOpacity = 0.5; worldPolygon.fill = am4core.color("#eee"); worldPolygon.propertyFields.fill = "color"; // Create country specific series (but hide it for now) var countrySeries = chart.series.push(new am4maps.MapPolygonSeries()); countrySeries.useGeodata = true; countrySeries.hide(); countrySeries.geodataSource.events.on("done", function (ev) { worldSeries.hide(); countrySeries.show(); }); var countryPolygon = countrySeries.mapPolygons.template; countryPolygon.tooltipText = "{name}"; countryPolygon.nonScalingStroke = true; countryPolygon.strokeOpacity = 0.5; countryPolygon.fill = am4core.color("#eee"); var hs = countryPolygon.states.create("hover"); hs.properties.fill = chart.colors.getIndex(9); // Set up click events worldPolygon.events.on("hit", function (ev) { ev.target.series.chart.zoomToMapObject(ev.target); var map = ev.target.dataItem.dataContext.map; var mapID = ev.target.dataItem.dataContext.id; if (map) { ev.target.isHover = false; countrySeries.geodataSource.url = "https://www.amcharts.com/lib/4/geodata/json/" + map + ".json"; countrySeries.geodataSource.load(); } }); // Set up data for countries var data = []; for (var id in am4geodata_data_countries2) { if (am4geodata_data_countries2.hasOwnProperty(id)) { var country = am4geodata_data_countries2[id]; for (var i in myJSON) { if (id == myJSON[i].Country_Code) { data.push({ id: id, color: chart.colors.getIndex(continents[country.continent_code]), map: country.maps[0] }); } } } } worldSeries.data = data; // Zoom control chart.zoomControl = new am4maps.ZoomControl(); var homeButton = new am4core.Button(); homeButton.events.on("hit", function () { worldSeries.show(); countrySeries.hide(); chart.goHome(); }); homeButton.icon = new am4core.Sprite(); homeButton.padding(7, 5, 7, 5); homeButton.width = 30; homeButton.icon.path = "M16,8 L14,8 L14,16 L10,16 L10,10 L6,10 L6,16 L2,16 L2,8 L0,8 L8,0 L16,8 Z M16,8"; homeButton.marginBottom = 10; homeButton.parent = chart.zoomControl; homeButton.insertBefore(chart.zoomControl.plusButton); }); // end am4core.ready()ii) Add the amCharts resources link, style for the map and the division ‘chartdiv’
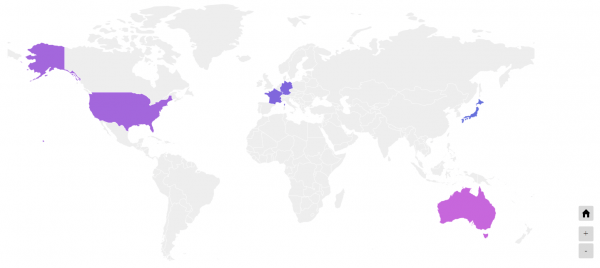
<!DOCTYPE html> <html> <head> <meta charset="UTF-8"> <title>World Map with highlight</title> <!-- Styles --> <style> #chartdiv { width: 100%; height: 500px; } </style> <!-- Resources --> <script src="https://www.amcharts.com/lib/4/core.js"></script> <script src="https://www.amcharts.com/lib/4/maps.js"></script> <script src="https://www.amcharts.com/lib/4/geodata/worldLow.js"></script> <script src="https://www.amcharts.com/lib/4/geodata/data/countries2.js"></script> <script src="https://www.amcharts.com/lib/4/themes/animated.js"></script> <script src="//ajax.googleapis.com/ajax/libs/jquery/1.12.4/jquery.min.js"></script> <script src="countryHighlightJS.js"></script> </head> <body> <div id="chartdiv"></div> </body> </html> - After all the steps are completed, you will be able to see the highlighted countries. If you click on the highlighted country, you will be able to view more details.

Conclusion #
Please note that if you follow the example above, the country codes for “AU”, “FR”, “US”, “JP”, “DE” will be highlighted only.


