Anonymous proxy servers are intermediate servers meant to hide the real identity or IP address of the requestor. Studies found that a large number of anonymous proxy users are generally responsible for online credit card fraud, forums and blogs spamming. Therefore, it is important to get more information about the anonymous proxy users. In this article, we will guide you on how to use IP2Proxy filter plugin with Elasticsearch, Filebeat, Logstash, and Kibana.
To follow this tutorial, you must have a working Elastic Stack environment. For the installation of the Elastic Stack, you may get it from https://www.elastic.co/downloads.
Configure Filebeat for Log using by Logstash #
- Download the suitable package for Filebeat from https://www.elastic.co/downloads/beats/filebeat and install it on your machine.
- Configure the filebeat.yml file that is located in your Filebeat root directory. Replace the content as follow:
filebeat.inputs: paths: - /path/to/log/file output.logstash: hosts: ["localhost:5043"] - For the sample data set that was used in this tutorial, you may get it from https://download.elastic.co/demos/logstash/gettingstarted/logstash-tutorial.log.gz.
- Unpack the file and make sure the paths field in the filebeat.yml is pointing correctly to the downloaded sample data set log file.
- Save the filebeat.yml file.
- Run the command below on your machine:
bin/filebeat -e -c filebeat.yml -d "publish"
Configure Logstash to use IP2Proxy filter plugin #
- Install the IP2Proxy filter plugin by:
bin/logstash-plugin install logstash-filter-ip2proxy
- Create a Logstash configuration pipeline named as test-pipeline.conf with the following contents:
input { beats { port => "5043" } } filter { grok { match => { "message" => "%{COMBINEDAPACHELOG}"} } ip2proxy { source => "[source][address]" } } output { elasticsearch { hosts => [ "localhost:9200" ] } } - Save the test-pipeline.conf file.
- Run the command below at your machine to start Logstash:
bin/logstash -f test-pipeline.conf --config.reload.automatic
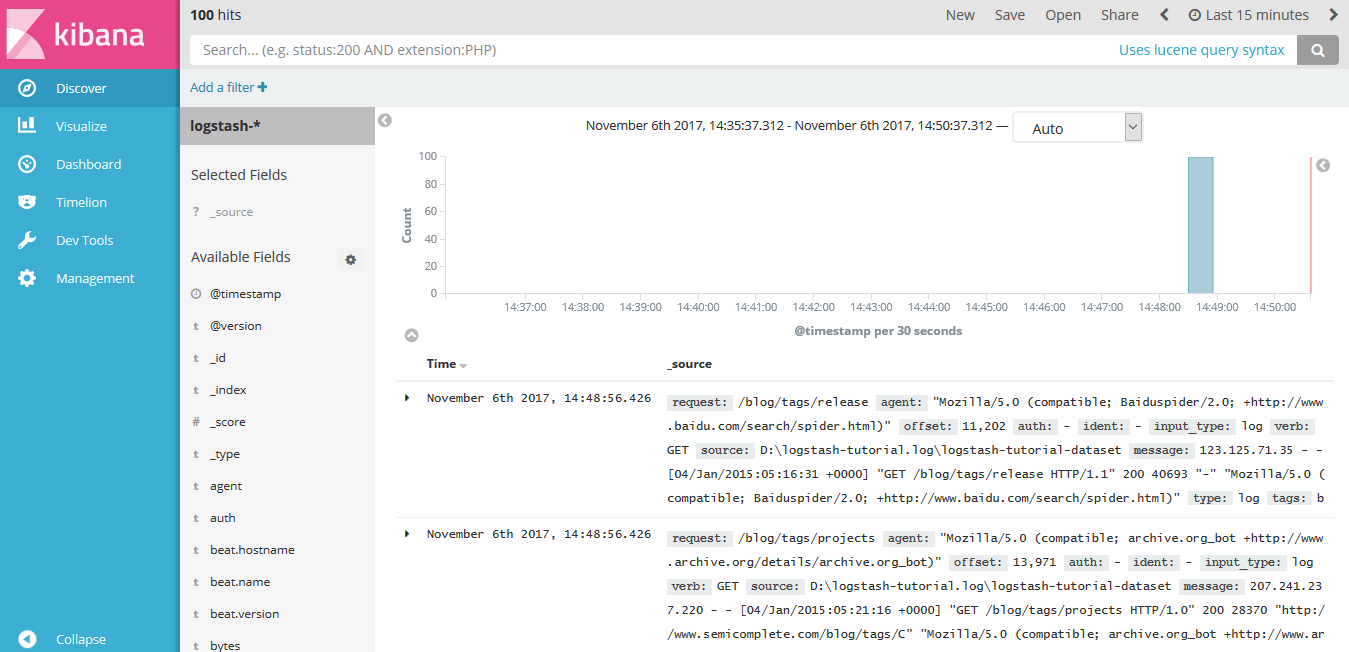
Visualize data in Kibana #
After you have successfully installed Kibana on your machine, you may use Kibana to view the data by opening Kibana in a web browser.
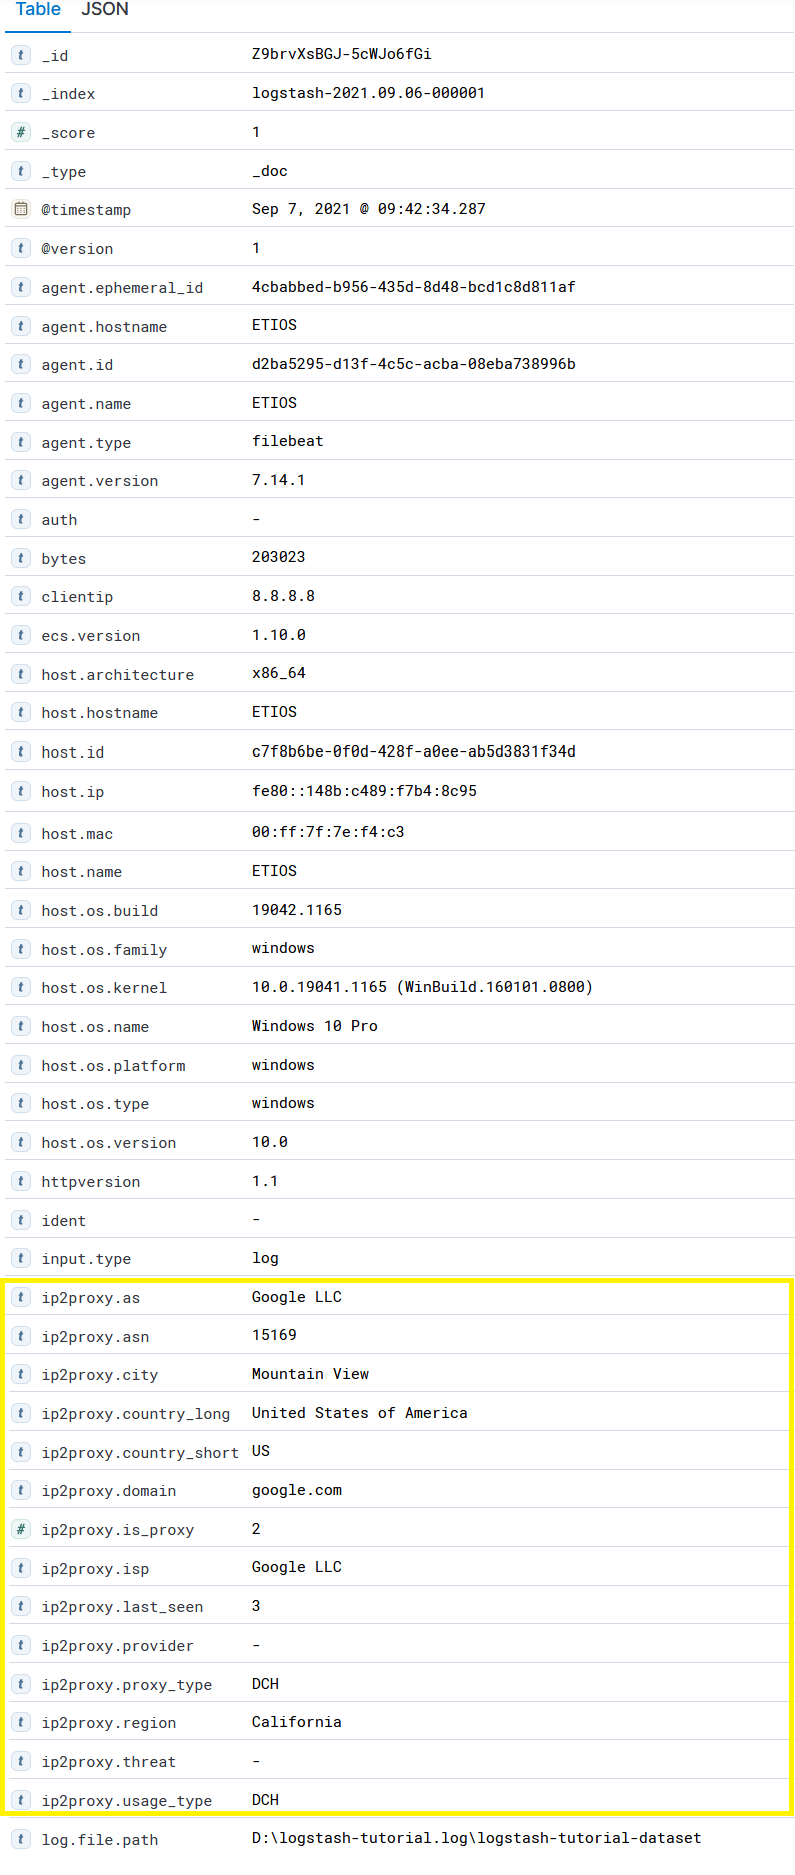
View data in Kibana Example obtained from IP2Proxy filter plugin with Elastic Stack using IP2Proxy PX11 BIN:
- Install the IP2Proxy filter plugin by: