
You are able to create region maps via the Kibana Visualize Service. Region maps are thematic maps in which boundary vector shapes are colored using a gradient. With the help of region maps, you will be able to learn more about your visitors. For example, where are they coming from, what is their time zone, and many other factors. In this article, we will guide you on how to create map visualization in Kibana using IP2Location data.
To follow this tutorial, you must have a working Kibana on your machine together with the data processed by the IP2Location plugin https://blog.ip2location.com/knowledge-base/how-to-use-ip2location-filter-plugin-with-elastic-stack/.
Visualize Region Map in Kibana #
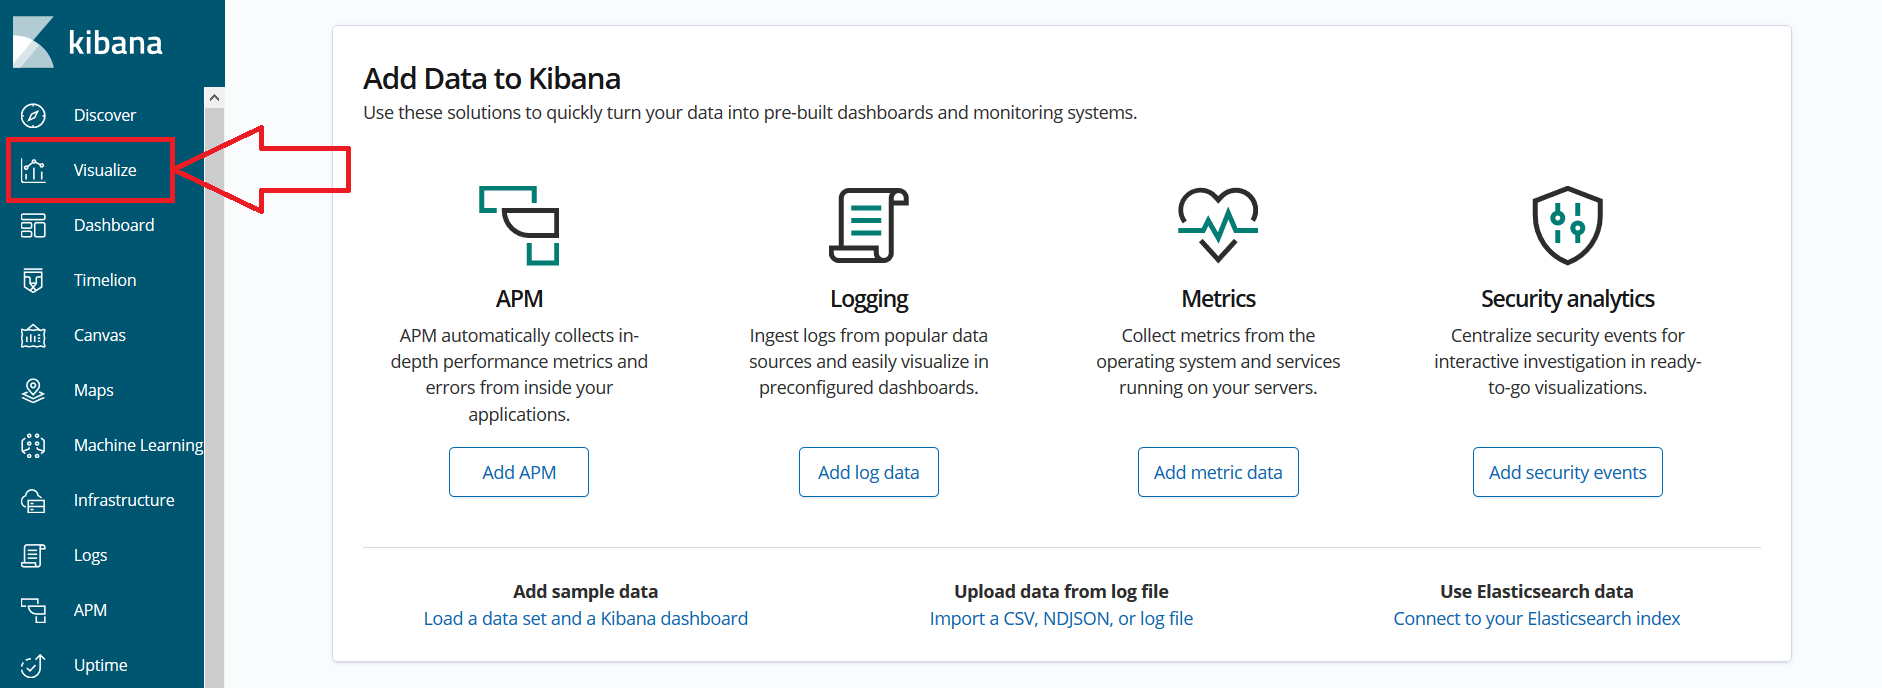
- Go to the Kibana home page and click on the Visualize menu.
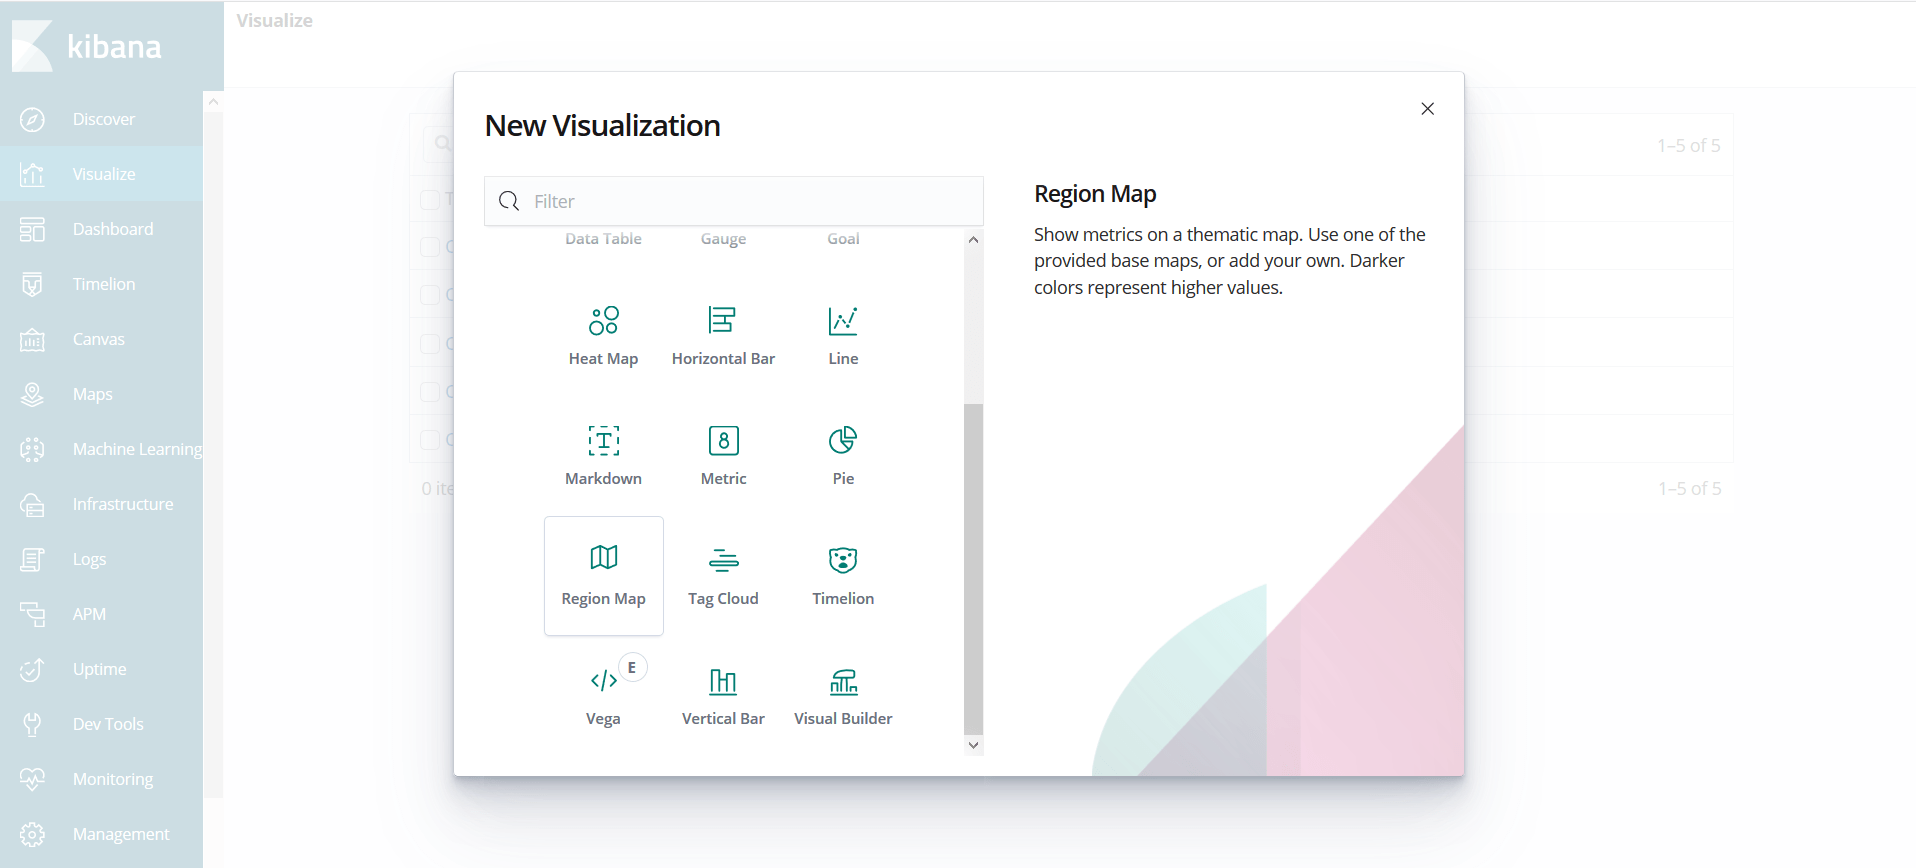
- In the Visualize page, click on the “+†button and select Region Map from the list.
- Select the index and proceed.
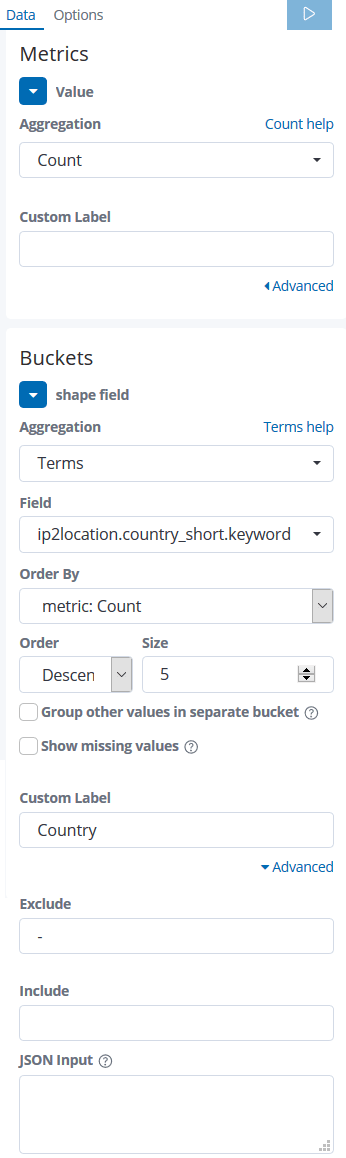
- Configure the Aggregation Metrics and Buckets Metrics as shown below. You should see the IP2Location object in the field input box. Select the country_short keyword data. Please note that you must exclude the ‘-‘ from the country short data.
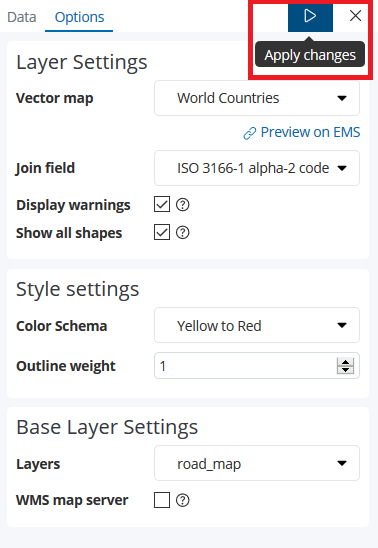
- Click on the Options tab and configure the Layers Settings, Style Settings and Base Layer Settings.
- Click on the button as shown to apply changes.
- Done.
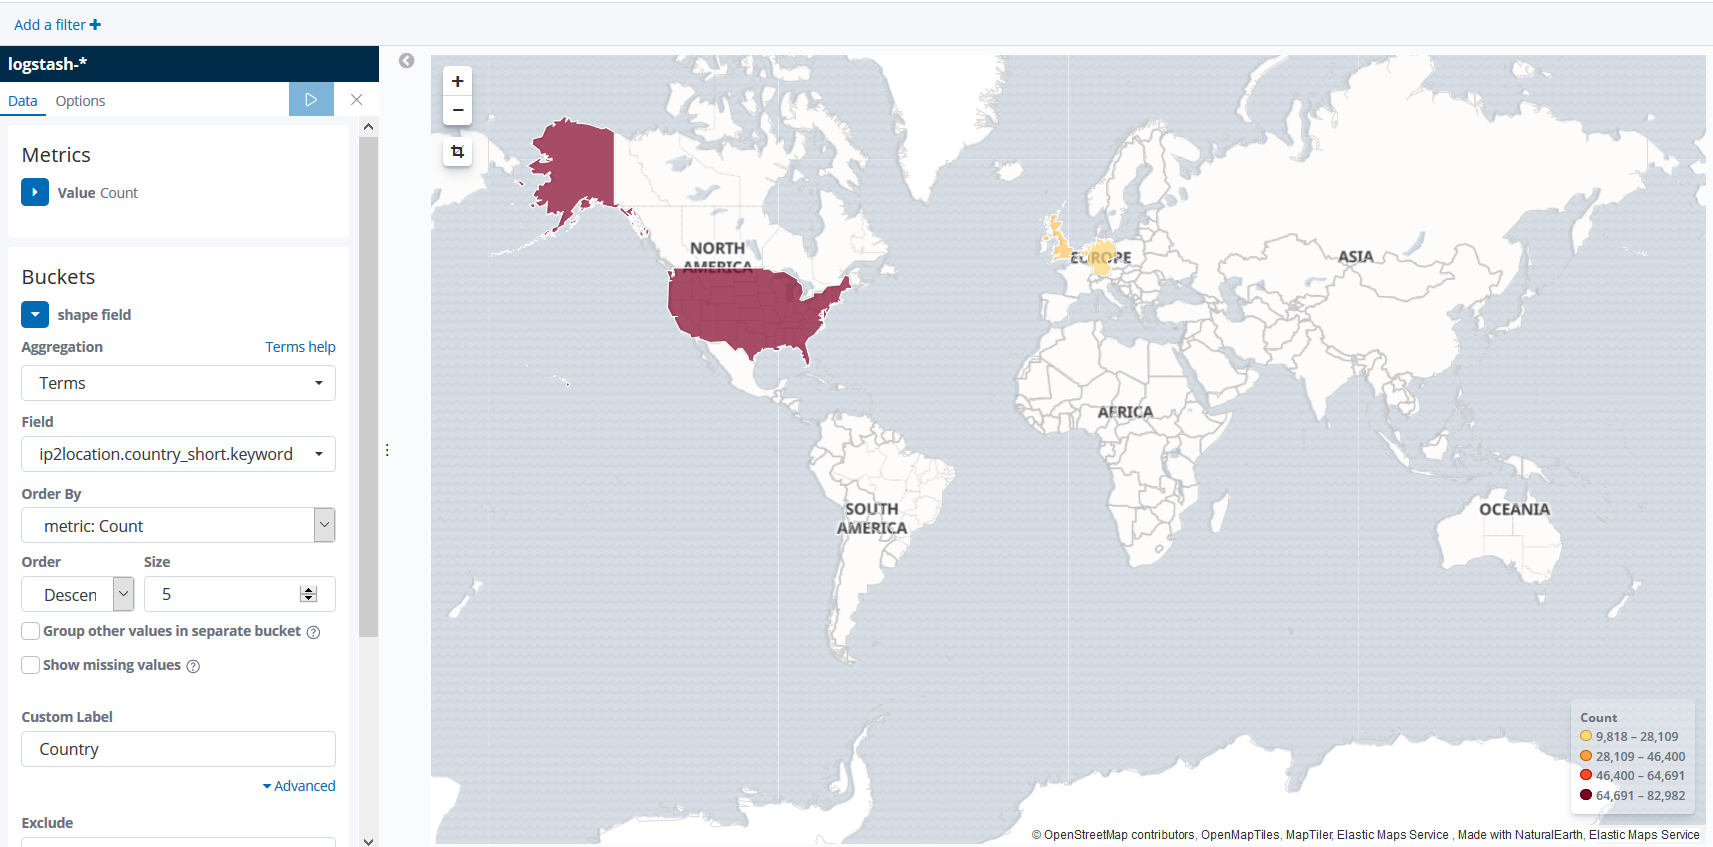
Once you’ve done the configuration steps, the details of the countries will be plotted on the world map as shown:


